| |
|
| Born: |
June 19, 1991 |
| Birthplace: |
Pacific Palisades,
CA |
| Height: |
5-10 |
| Weight: |
190 |
| Bats: |
Both |
| Throws: |
Right |
| |
|
| Drafted: |
8th round, 2012 by HOU |
| How Acquired: |
Traded from New York (NL) for cash
considerations (Feb. 2024) |
| College: |
UCLA |
| High School: |
Windward (CA) |
| |
|
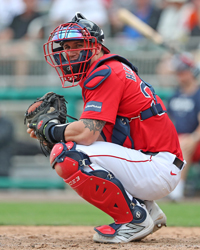
Photo ©
Kelly O'Connor
Tyler Heineman photos by Kelly O'Connor
|
|
Pronunciation: |
HINE-uh-man |
| First Pro Contract: |
June 22, 2012 (HOU) |
| Signing Scout: |
Tim Costic |
|
Signing Bonus: |
$125,000 |
| |
|
| Pro Debut: |
June 29, 2012 (Tri-City) |
| MLB Debut: |
September 4, 2019 (MIA) |
| |
|
| Twitter: |
@theineman13 |
| Instagram: |
@theineman13 |
Claimed off waivers by Toronto (September 2024)
| |